Mapping global distribution for any taxonomic level
Source:vignettes/mapping_distribution.Rmd
mapping_distribution.RmdHere in this article, we show how to use the package’s function
powoMap for mapping the global distribution for any genus
or family of plants either at political country or botanical country
levels, following the World Geographical Scheme
for Recording Plant Distributions. The powoMap can use
as input data the dataframe-formatted resulting query from
powoSpecies function or an external spreadsheet. Then,
powoMap can automatically create one global distribution
map for the entire group (e.g., order, family) or multiple maps for each
desired taxonomic level within the input data (e.g., genus). The map is
colored according to the species richness using either Viridis or RColorBrewer
color palettes.
Setup
Install the latest development version of expowo from GitHub:
#install.packages("devtools")
devtools::install_github("DBOSlab/expowo")1. Mining species distribution from POWO to use as input data in powoMap
To create global distribution maps using powoMap
function, you can either import a spreadsheet or use the package’s
powoSpecies function to get distribution information for
the species of the target family or genus. It is possible to adjust one
of the arguments in powoSpecies function to extract data
only from a genus or list of genera.
The example below shows how to mine the distribution for an specific
genus of Lecythidaceae. By defining a vector within the argument
genus, here the function will search for all species and
associated distribution data for just the genus Cariniana. Note
that we create an object called mapspdist, which is the
dataframe-formatted input data to create the map. The output shown here
(TABLE 1) is a simplified version, where we have removed some columns so
as to focus on the display of just the distribution data.
mapspdist <- powoSpecies(family = "Lecythidaceae",
                         genus = "Cariniana",
                         hybridspp = FALSE,
                         country = NULL,
                         verbose = TRUE,
                         save = FALSE,
                         dir = "results_powoSpecies",
filename = "Lecythidaceae_Cariniana")| family | taxon_name | native_to_country | native_to_botanical_countries | kew_id |
|---|---|---|---|---|
| Lecythidaceae | Cariniana domestica | Bolivia, Brazil | Bolivia, Brazil North, Brazil West-Central | 592121-1 |
| Lecythidaceae | Cariniana estrellensis | Bolivia, Brazil, Paraguay | Bolivia, Brazil North, Brazil Northeast, Brazil South, Brazil Southeast, Brazil West-Central, Paraguay | 47516-2 |
| Lecythidaceae | Cariniana ianeirensis | Bolivia, Brazil | Bolivia, Brazil Southeast | 47518-2 |
| Lecythidaceae | Cariniana legalis | Brazil | Brazil Northeast, Brazil Southeast | 592126-1 |
| Lecythidaceae | Cariniana micrantha | Bolivia, Brazil | Bolivia, Brazil North, Brazil West-Central | 47522-2 |
| Lecythidaceae | Cariniana parvifolia | Brazil | Brazil Southeast | 302134-2 |
| Lecythidaceae | Cariniana penduliflora | Brazil | Brazil North | 47527-2 |
| Lecythidaceae | Cariniana pyriformis | Colombia, Venezuela | Colombia, Venezuela | 592127-1 |
| Lecythidaceae | Cariniana rubra | Brazil | Brazil North, Brazil Southeast, Brazil West-Central | 592128-1 |
2. Creating global-scale map for one genus to show species richness at political country level
To generate a global distribution map for one genus that show species
richness at political country level, you can use the previously
generated mapspdist object as input data of the
powoMap function and set the distcol argument
as “native_to_country”. This is the very column of the
dataframe-formatted mapspdist object that is associated to
species distribution at political country.
The example below shows how to create the global distribution map of
Cariniana’s species richness as colored by the
viridis palette of the Viridis package. If
you set up both the arguments vir_color and
bre_color with any of the Viridis and
RColorBrewer color palettes, then two maps colored
respectively by these color vectors will be automatically generated.
Different file formats and resolutions (e.g. JPG, PDF, PNG, TIFF) are
also supported by setting the arguments format and
dpi.
powoMap(inputdf = mapspdist,
        botctrs = FALSE,
        distcol = "native_to_country",
        taxclas = "genus",
        verbose = FALSE,
        save = FALSE,
        vir_color = "viridis",
        bre_color = NULL,
        leg_title = "SR",
        dpi = 600,
        dir = "results_powoMap",
        filename = "global_richness_country_map",
format = "jpg") 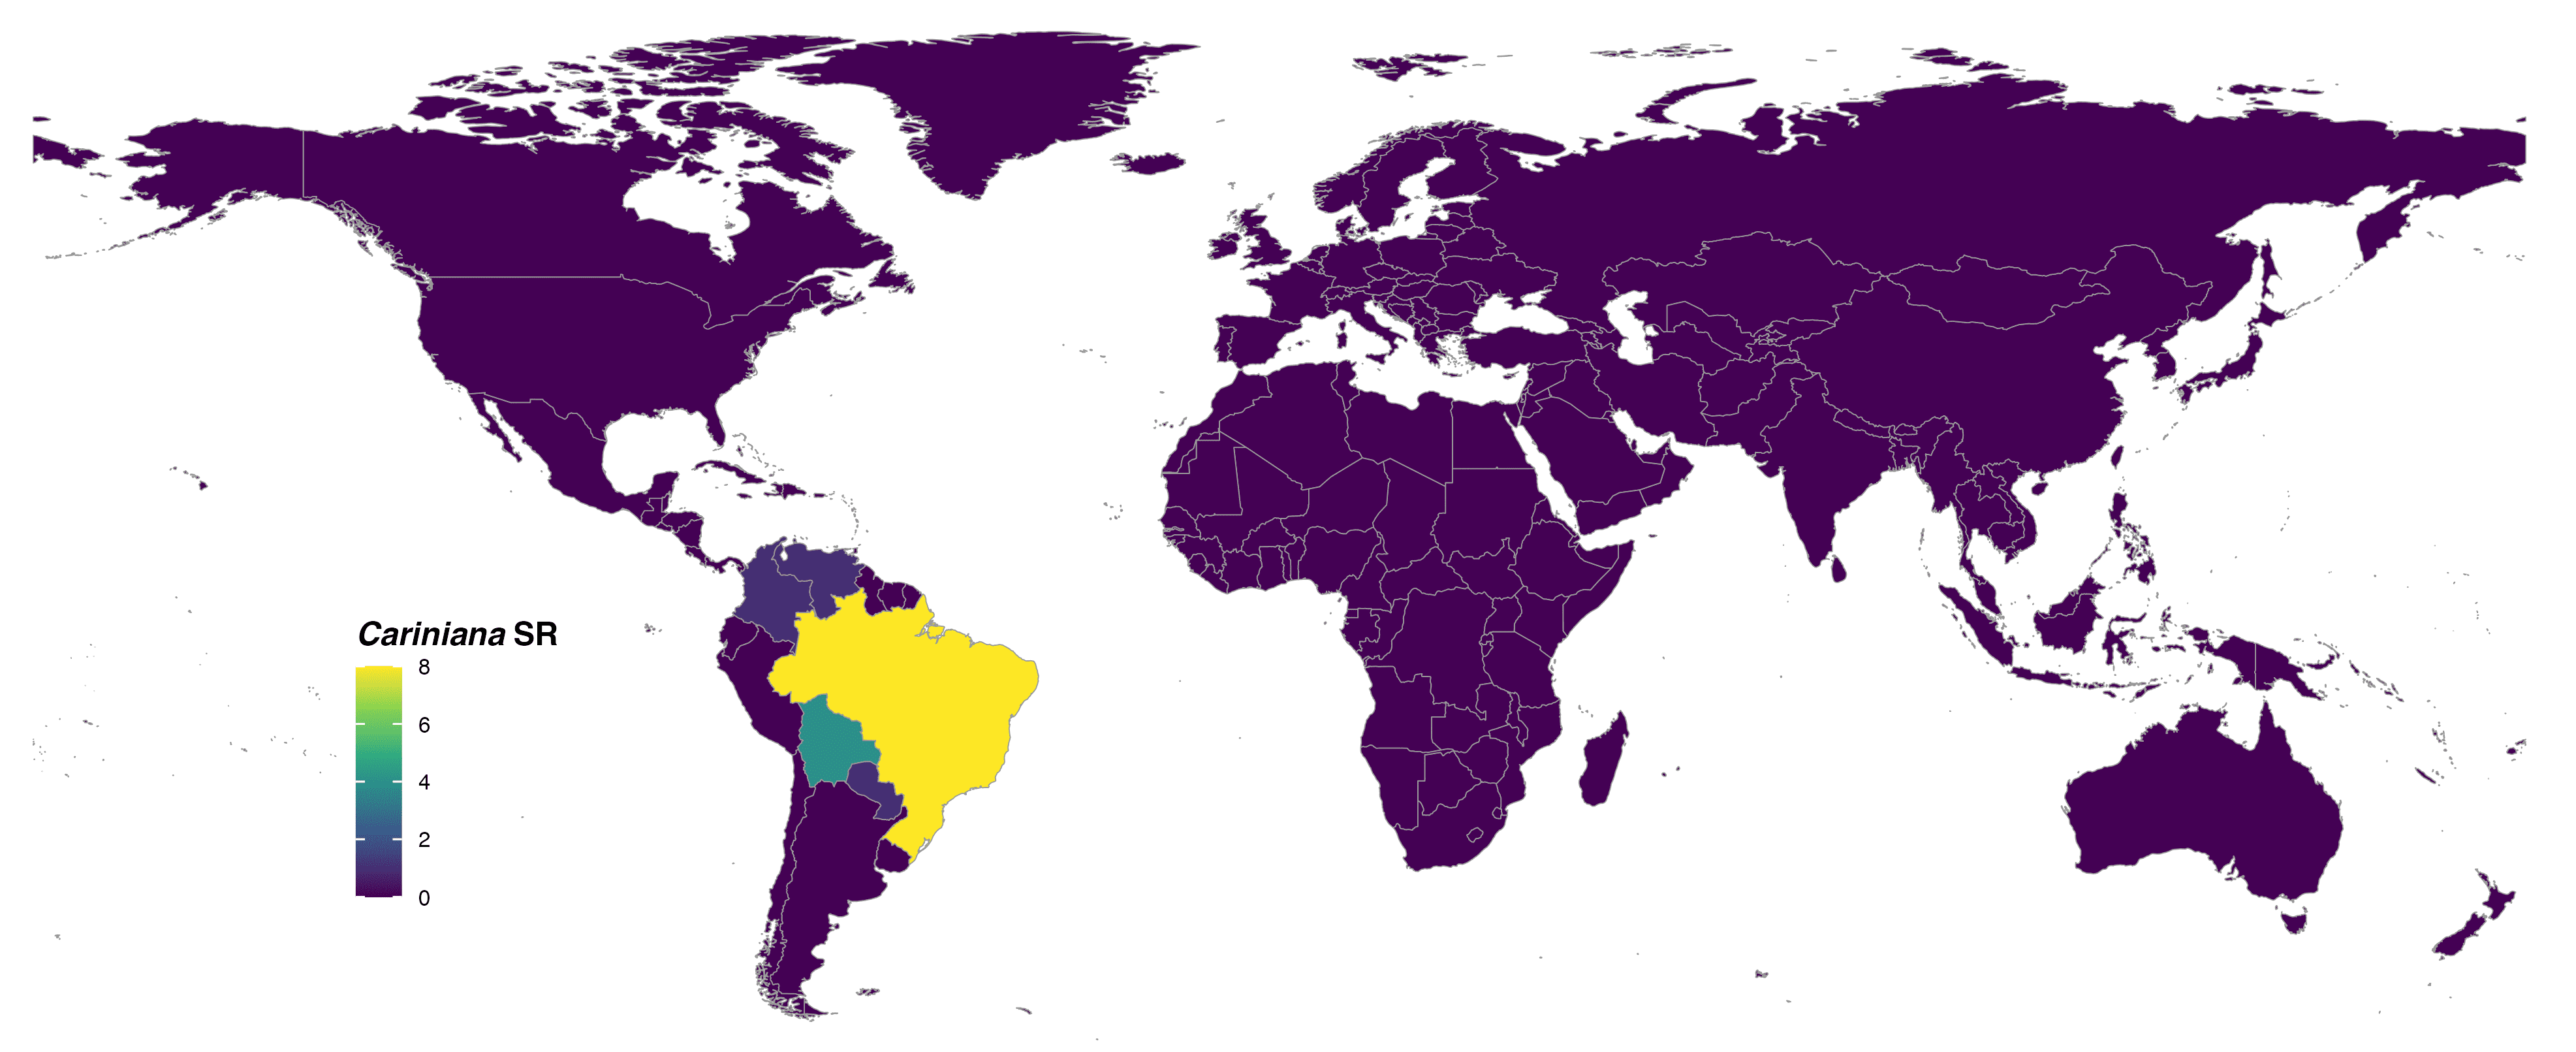
FIGURE 1. Global species richness of the genus Cariniana at country level and colored with viridis scale.
3. Creating global-scale map for one genus to show species richness at botanical country level
To generate a global distribution map for one genus that show species
richness at botanical country level, adjust the argument
botctrs within the powoMap function to TRUE.
Then, use the previously generated mapspdist object as
input data in inputdf and set the distcol
argument to the name of the column with distribution according to
botanical countries between quotation marks. This is the column of the
dataframe-formatted mapspdist object or from an external
spreadsheet.
The example below shows how to create the global distribution map of
Cariniana’s species richness according to botanical countries
and colored by the viridis palette of the
Viridis package. If you set up both the arguments
vir_color and bre_color with any of the
Viridis and RColorBrewer color
palettes, then two maps colored respectively by these color vectors will
be automatically generated. Different file formats and resolutions
(e.g. JPG, PDF, PNG, TIFF) are also supported by setting the arguments
format and dpi.
powoMap(inputdf = mapspdist,
        botctrs = TRUE,
        distcol = "native_to_botanical_countries",
        taxclas = "genus",
        verbose = FALSE,
        save = FALSE,
        vir_color = "viridis",
        bre_color = NULL,
        leg_title = "SR",
        dpi = 600,
        dir = "results_powoMap",
        filename = "global_richness_botcountry_map",
        format = "jpg")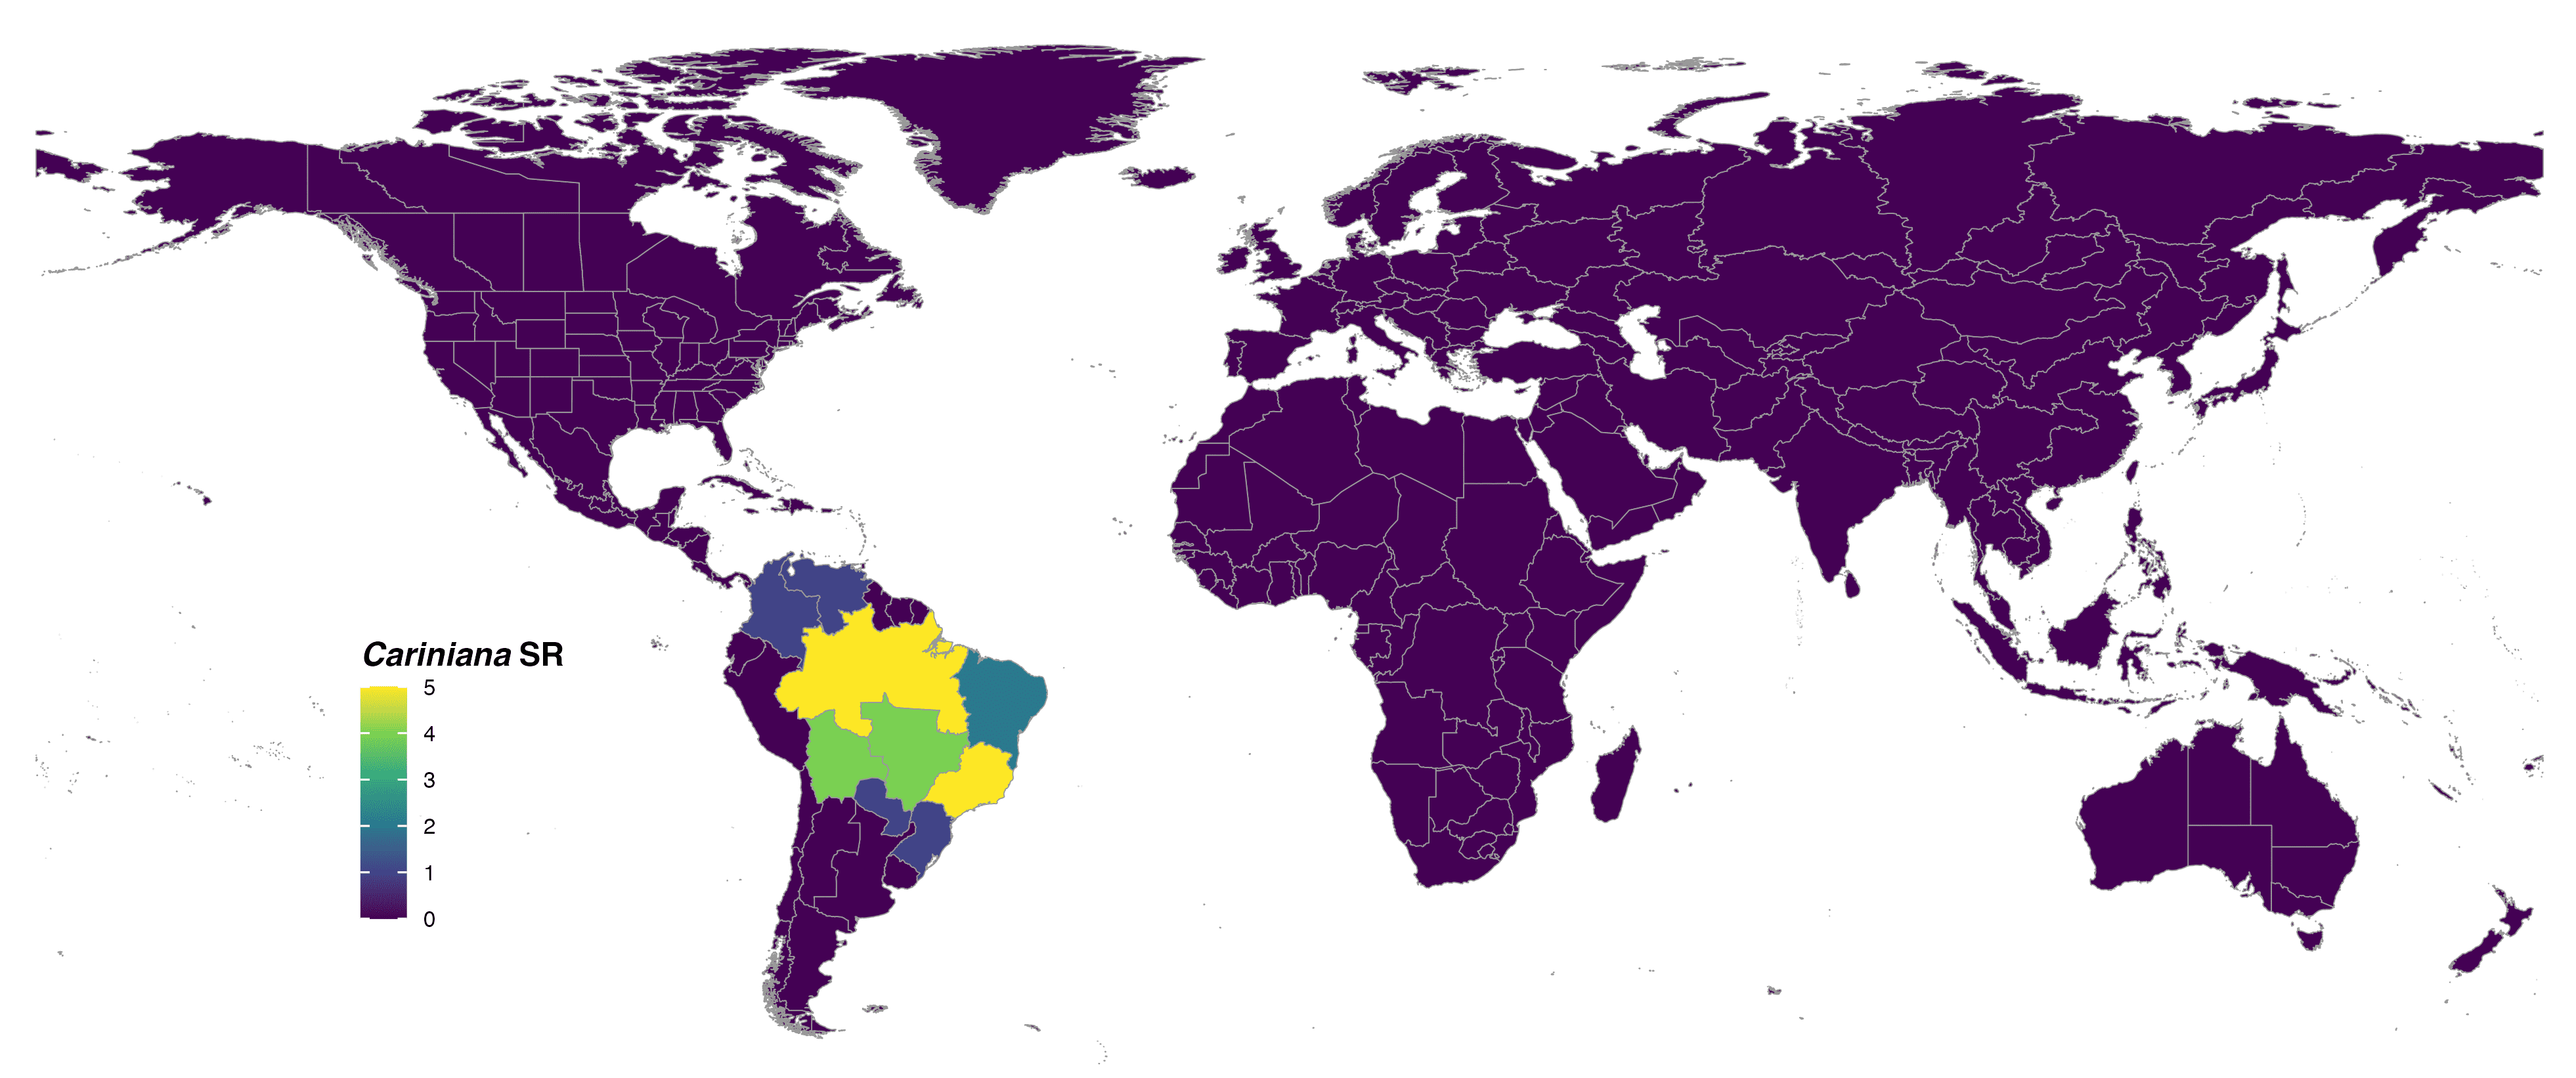
FIGURE 2. Global species richness of the genus Cariniana at botanical country level and colored with viridis scale.
4. Creating global-scale map of species richness for an entire family
To generate a family-level global distribution map of species
richness, use powoSpecies function without any genus
constraint so as to query a full species list of the desired family and
the associated distribution data. Then, the resulting query object
should be used as input data of the powoMap function.
mapspdist <- powoSpecies(family = "Lecythidaceae",
                         genus = NULL,
                         hybridspp = FALSE,
                         country = NULL,
                         verbose = FALSE,
                         save = FALSE,
                         dir = "results_powoSpecies",
                         filename = "Lecythidaceae")
The example below uses the previously generated dataframe-formatted
mapspdist object as input data to powoMap
function, with the distcol argument set as
“native_to_country”, the taxclas argument set as
"family", the vir_color argument set as
“viridis”, and the bre_color argument set as “Spectral”, so
as to automatically produce two global distribution
maps of all Lecythidaceae’s species richness at country
level, which are distinctly colored by Viridis and
RColorBrewer color palettes.
Note that if you had set here the taxclas as
"genus", then the powoMap function would have
produced individual distribution maps of species richness for every
single genus within Lecythidaceae, all of them being stored in the
desired directory at dir argument.
powoMap(inputdf = mapspdist,
        botctrs = FALSE,
        distcol = "native_to_country",
        taxclas = "family",
        verbose = FALSE,
        save = FALSE,
        vir_color = "viridis",
        bre_color = "Spectral",
        leg_title = "SR",
        dpi = 600,
        dir = "results_powoMap/",
        filename = "global_richness_botcountry_map",
        format = "jpg")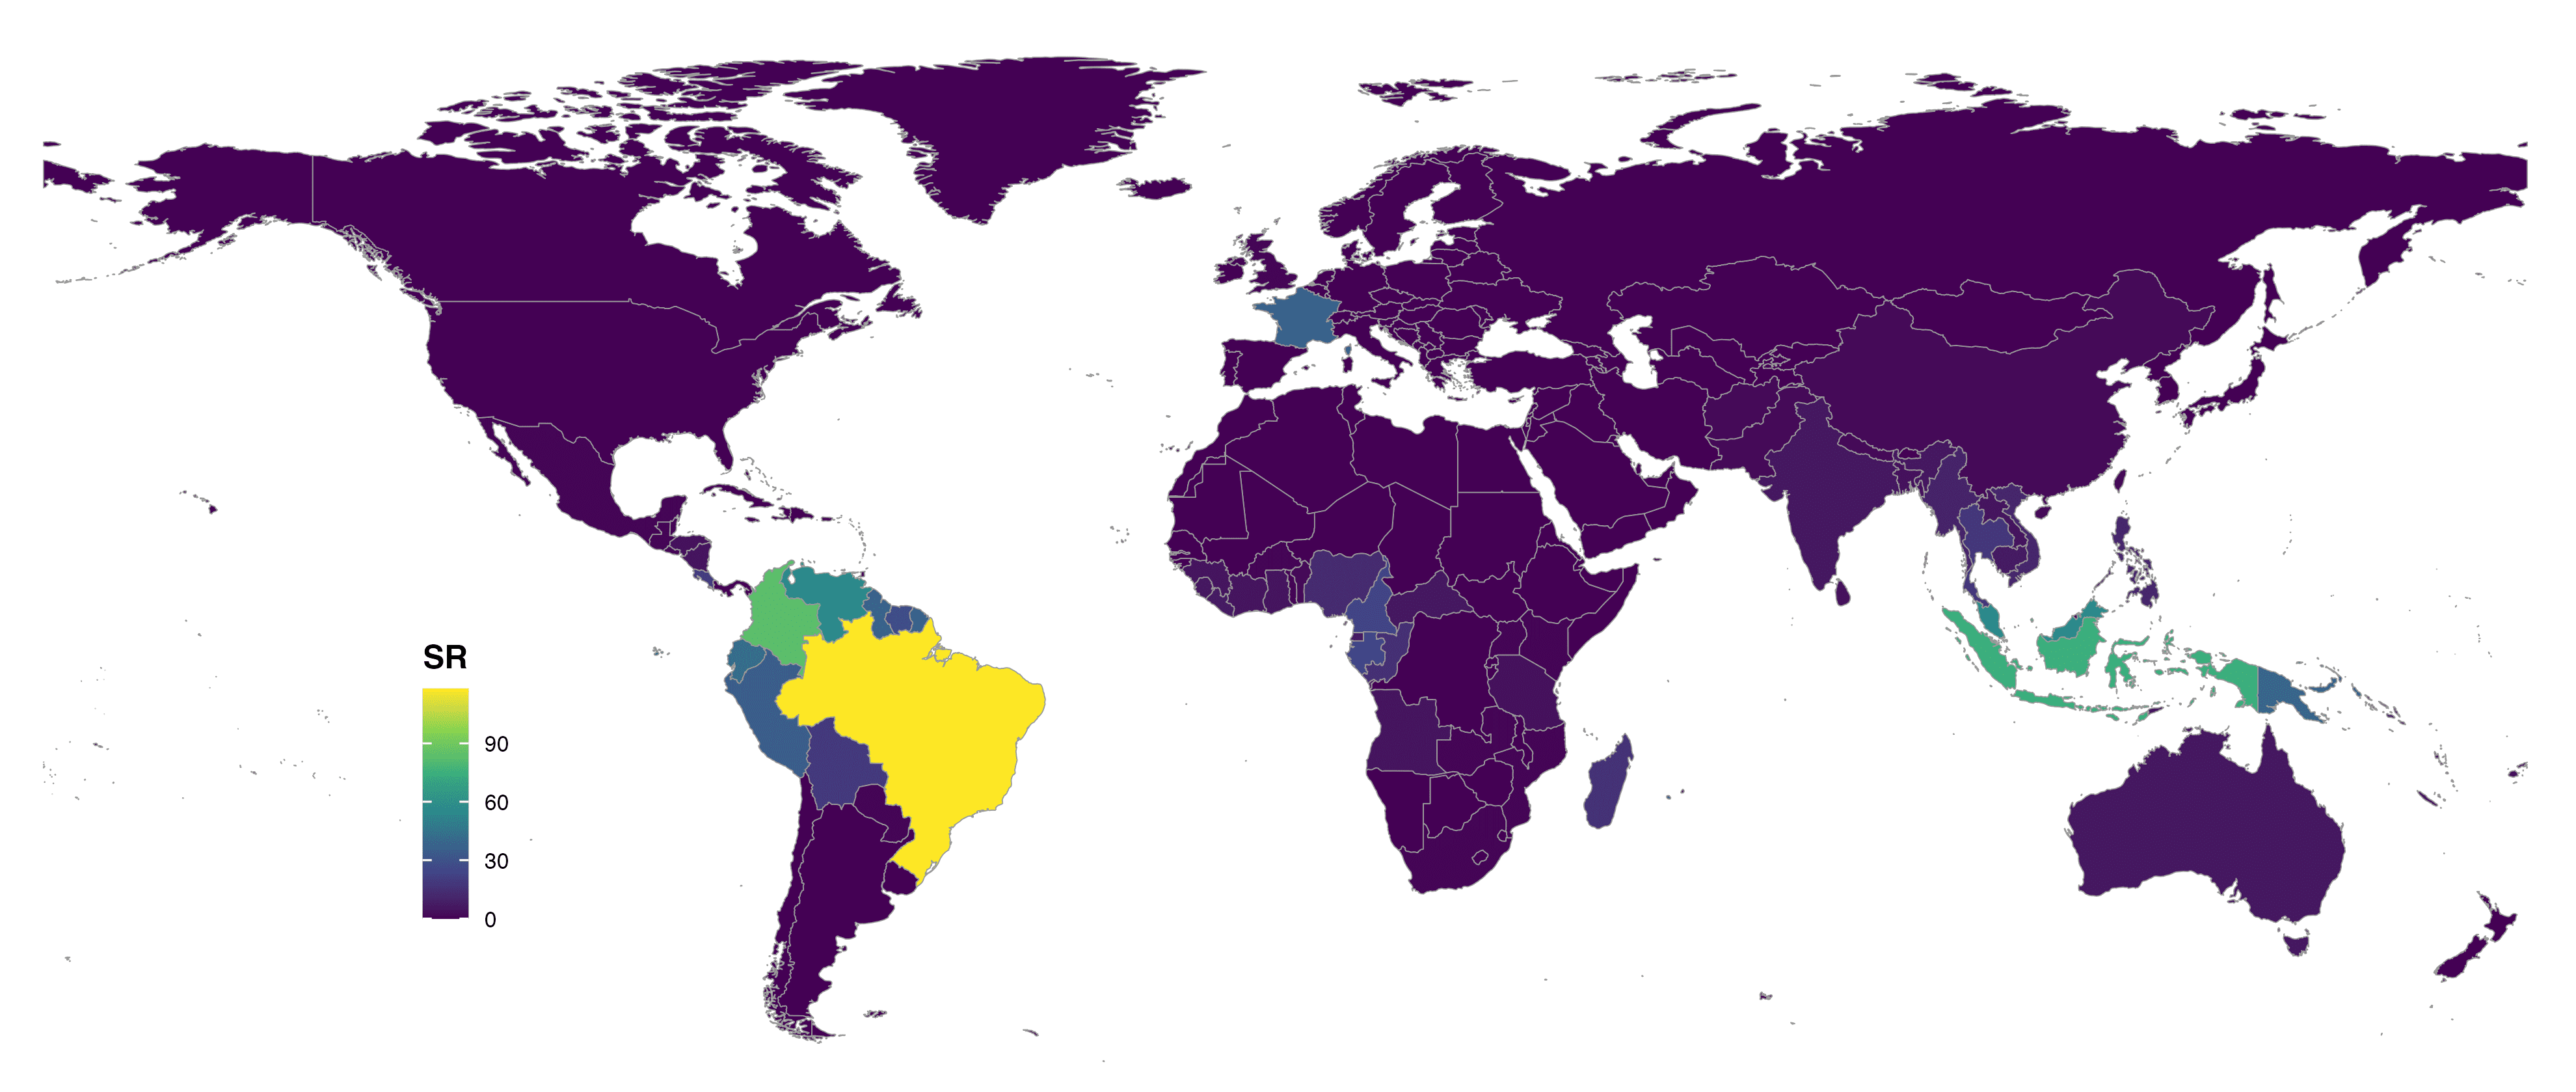
FIGURE 3. Global species richness of Lecythidaceae at country level and colored with viridis scale.
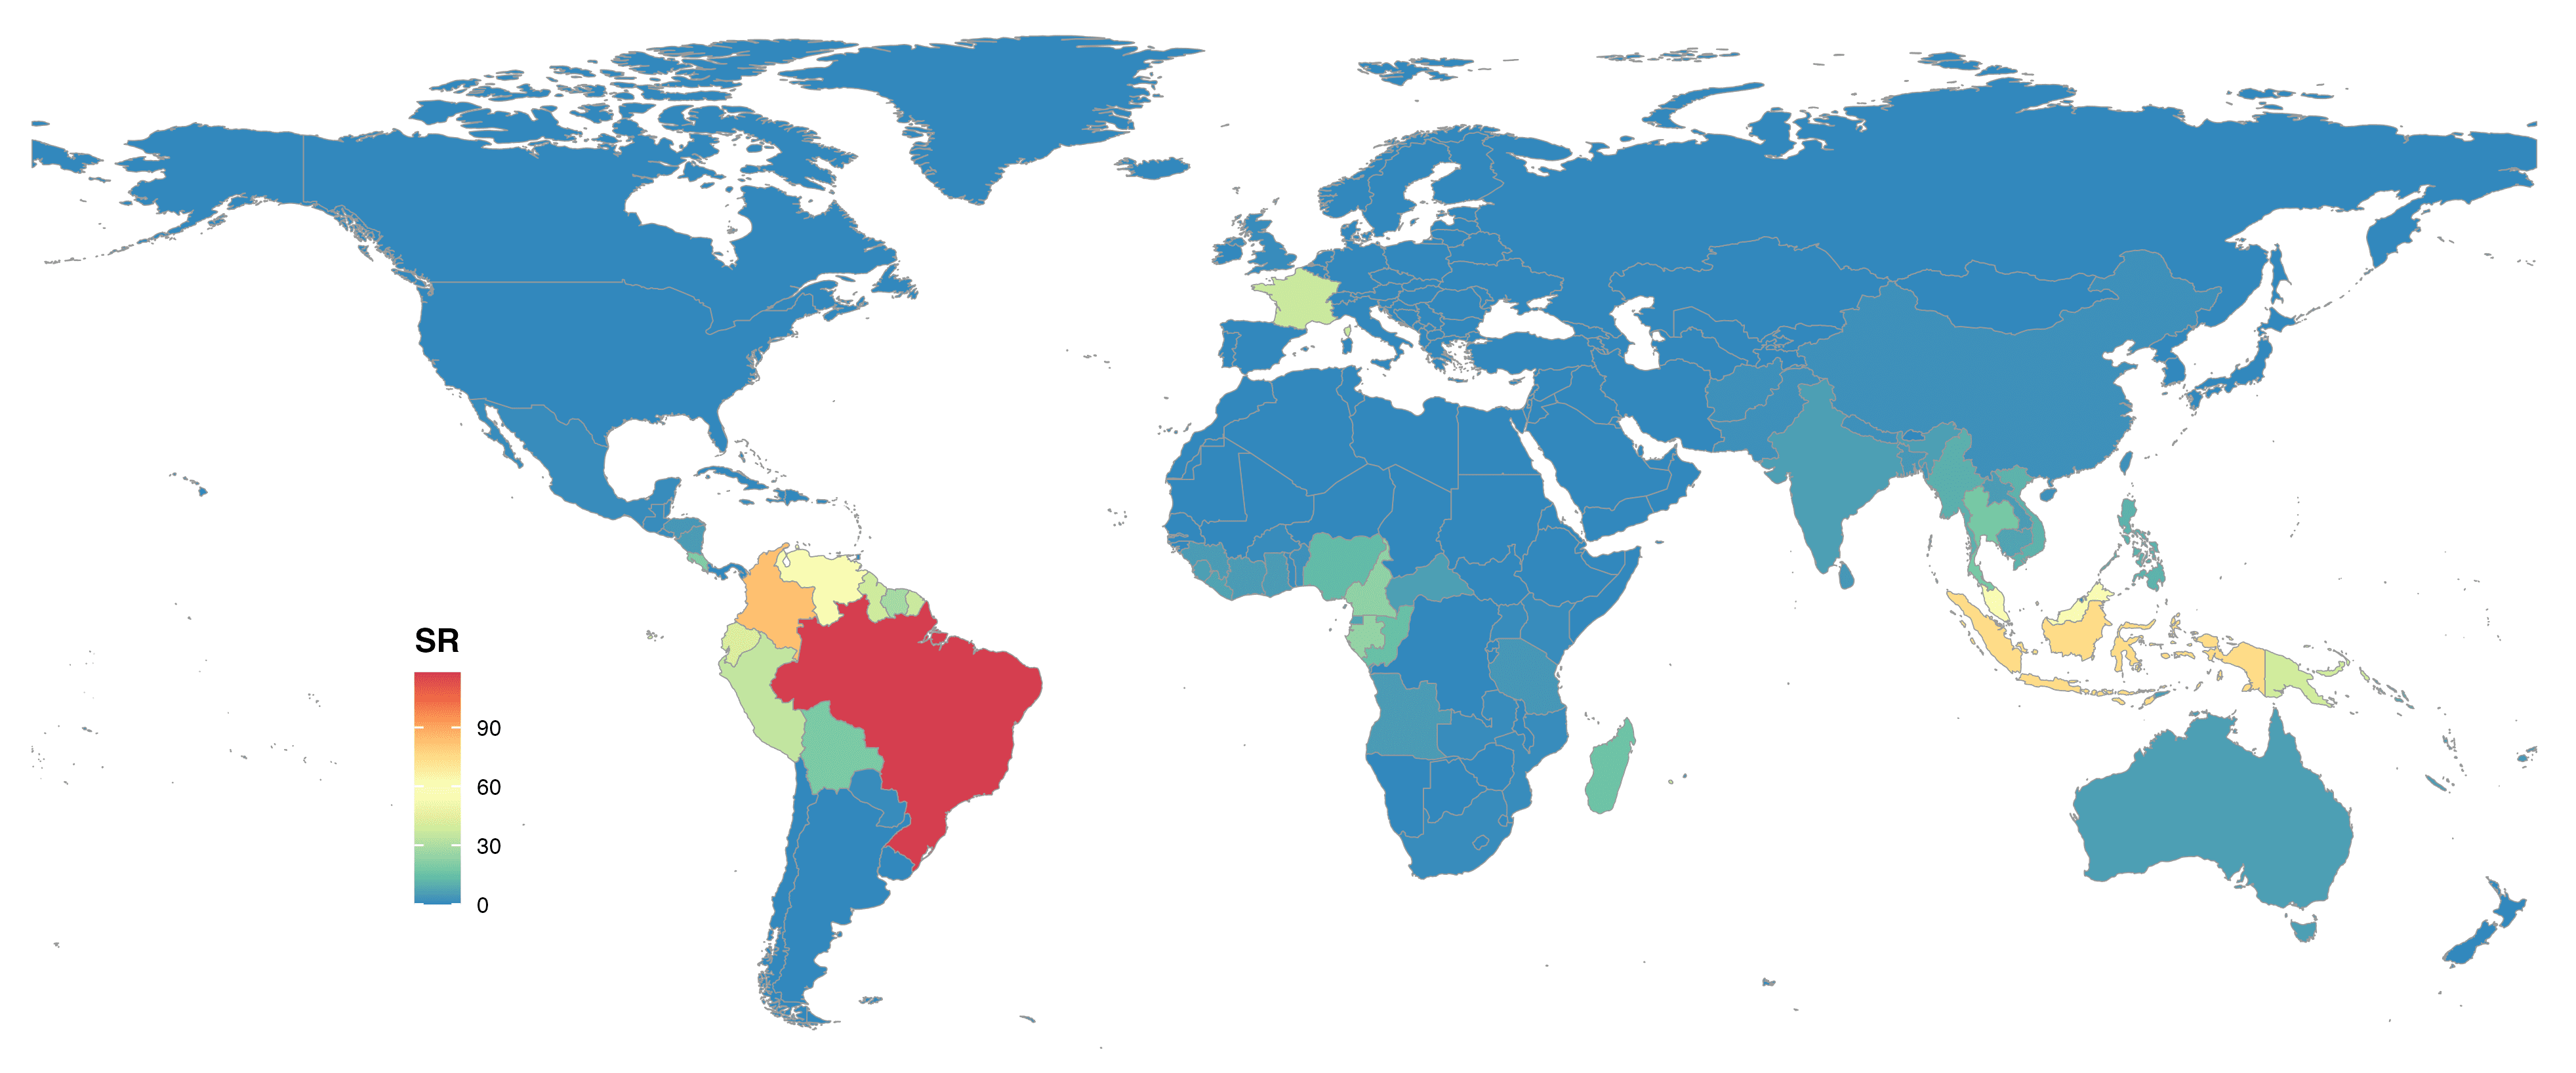
FIGURE 4. Global species richness of Lecythidaceae at country level and colored with Spectral scale.
To create global maps of Lecythidaceae according to botanical countries,
change the argument distcol to
“native_to_botanical_countries”, the vir_color argument to
“viridis”, and the bre_color argument to “Spectral”. This
automatically produce two global distribution maps of Lecythidaceae’s
species richness at botanical countries, which are distinctly colored by
Viridis and RColorBrewer color palettes.
Note that if you had set here the taxclas as
"genus", then the powoMap function would have
produced individual distribution maps of species richness for every
single genus within Lecythidaceae, all of them being stored in the
desired directory at dir argument.
powoMap(inputdf = mapspdist,
        botctrs = TRUE,
        distcol = "native_to_botanical_countries",
        taxclas = "family",
        verbose = FALSE,
        save = FALSE,
        vir_color = "viridis",
        bre_color = "Spectral",
        leg_title = "SR",
        dpi = 600,
        dir = "results_powoMap",
        filename = "global_richness_botcountry_map",
        format = "jpg")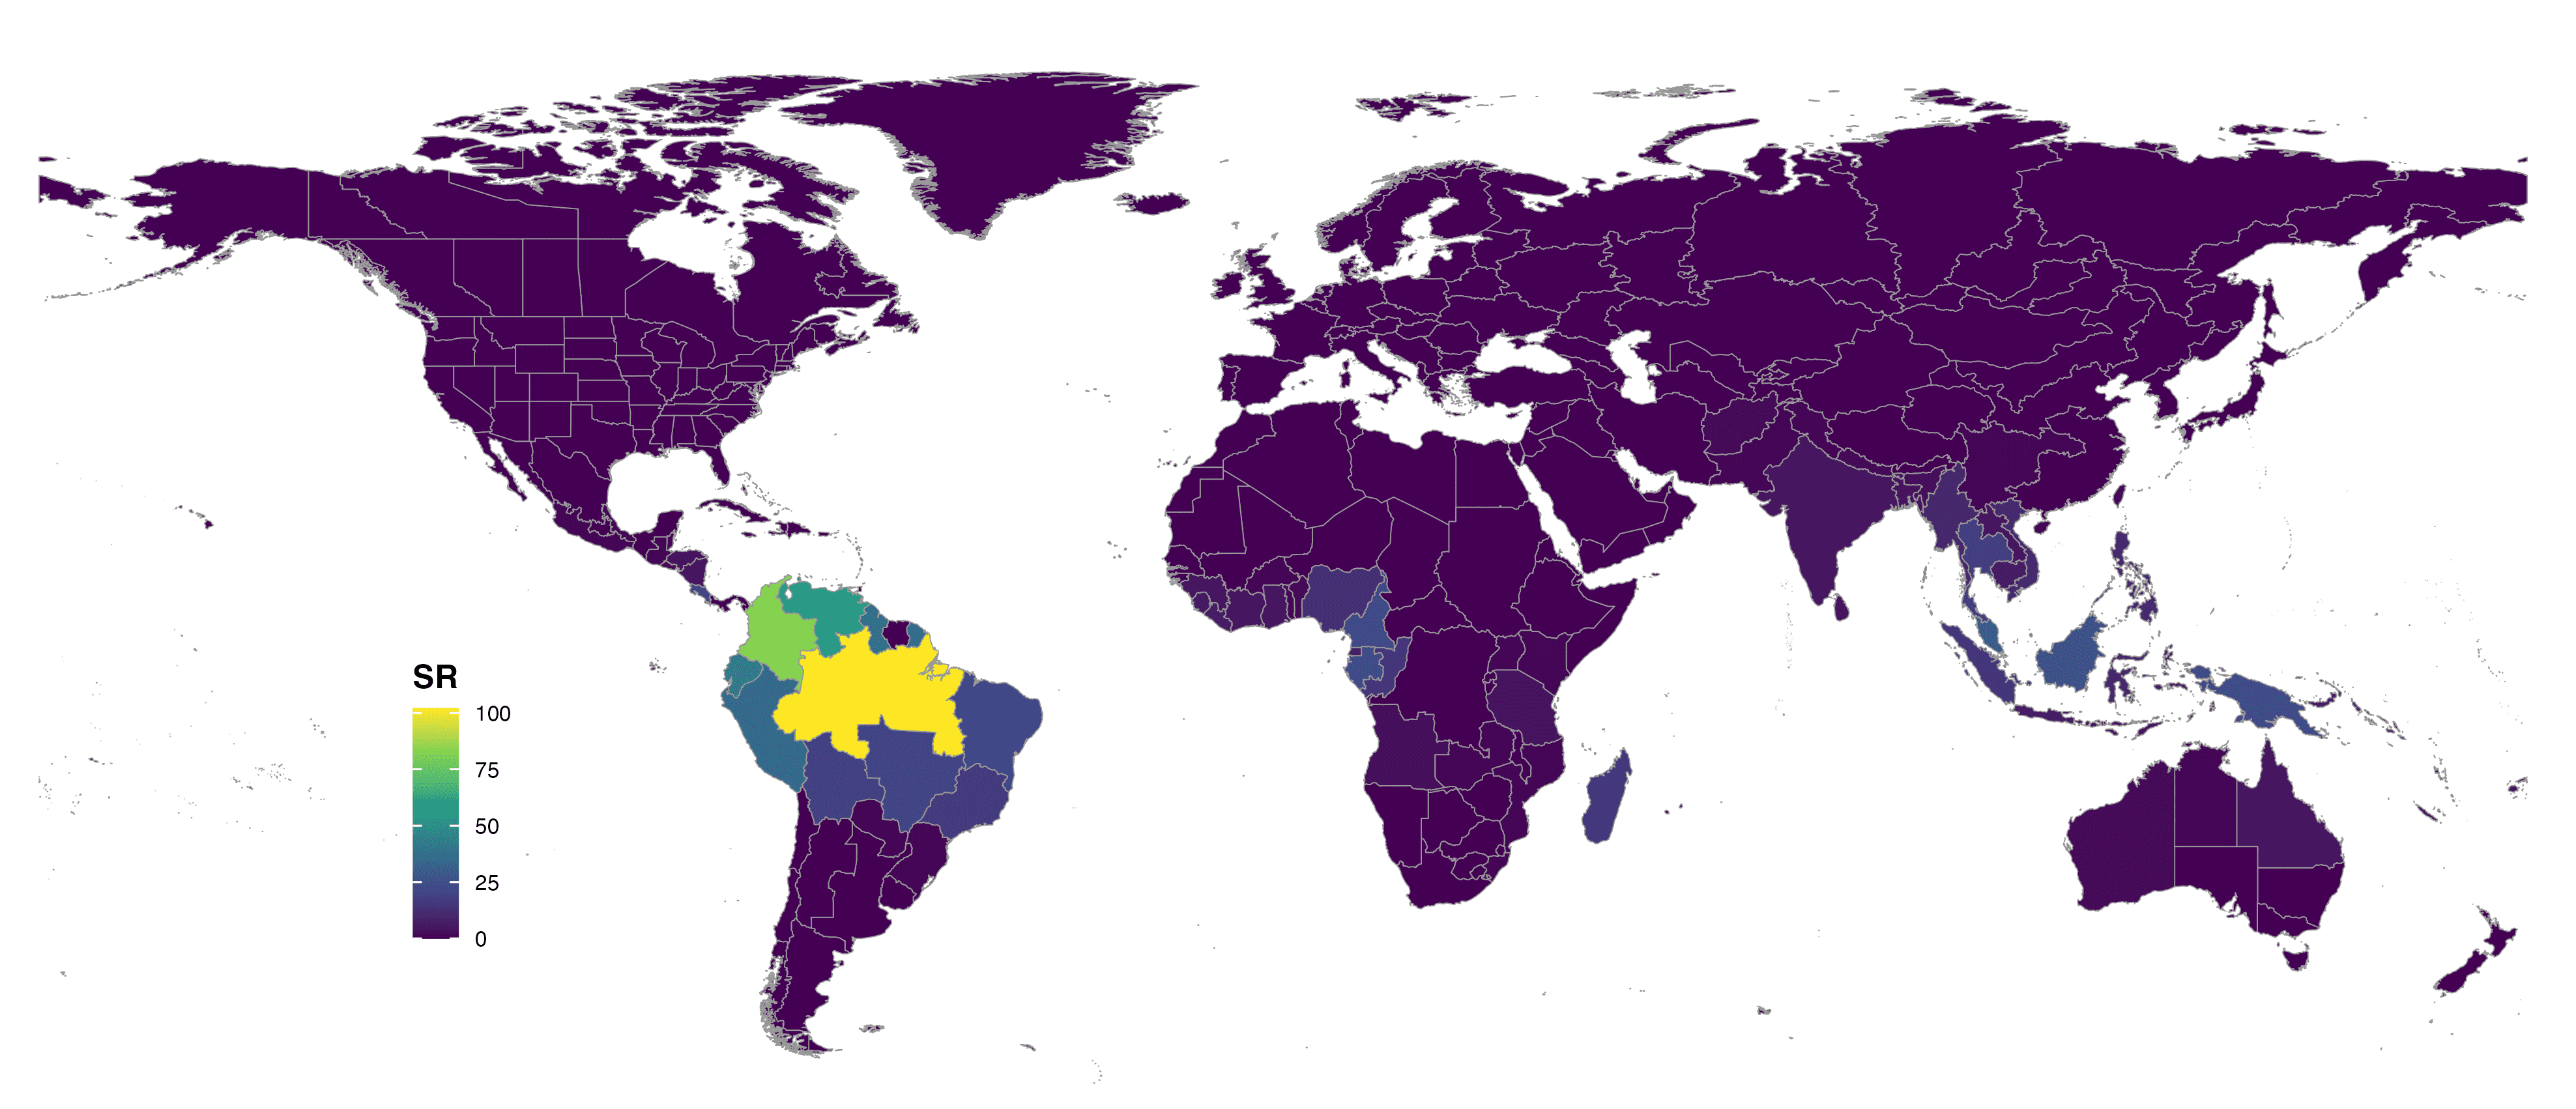
FIGURE 5. Global species richness of Lecythidaceae at botanical countries and colored with viridis scale.
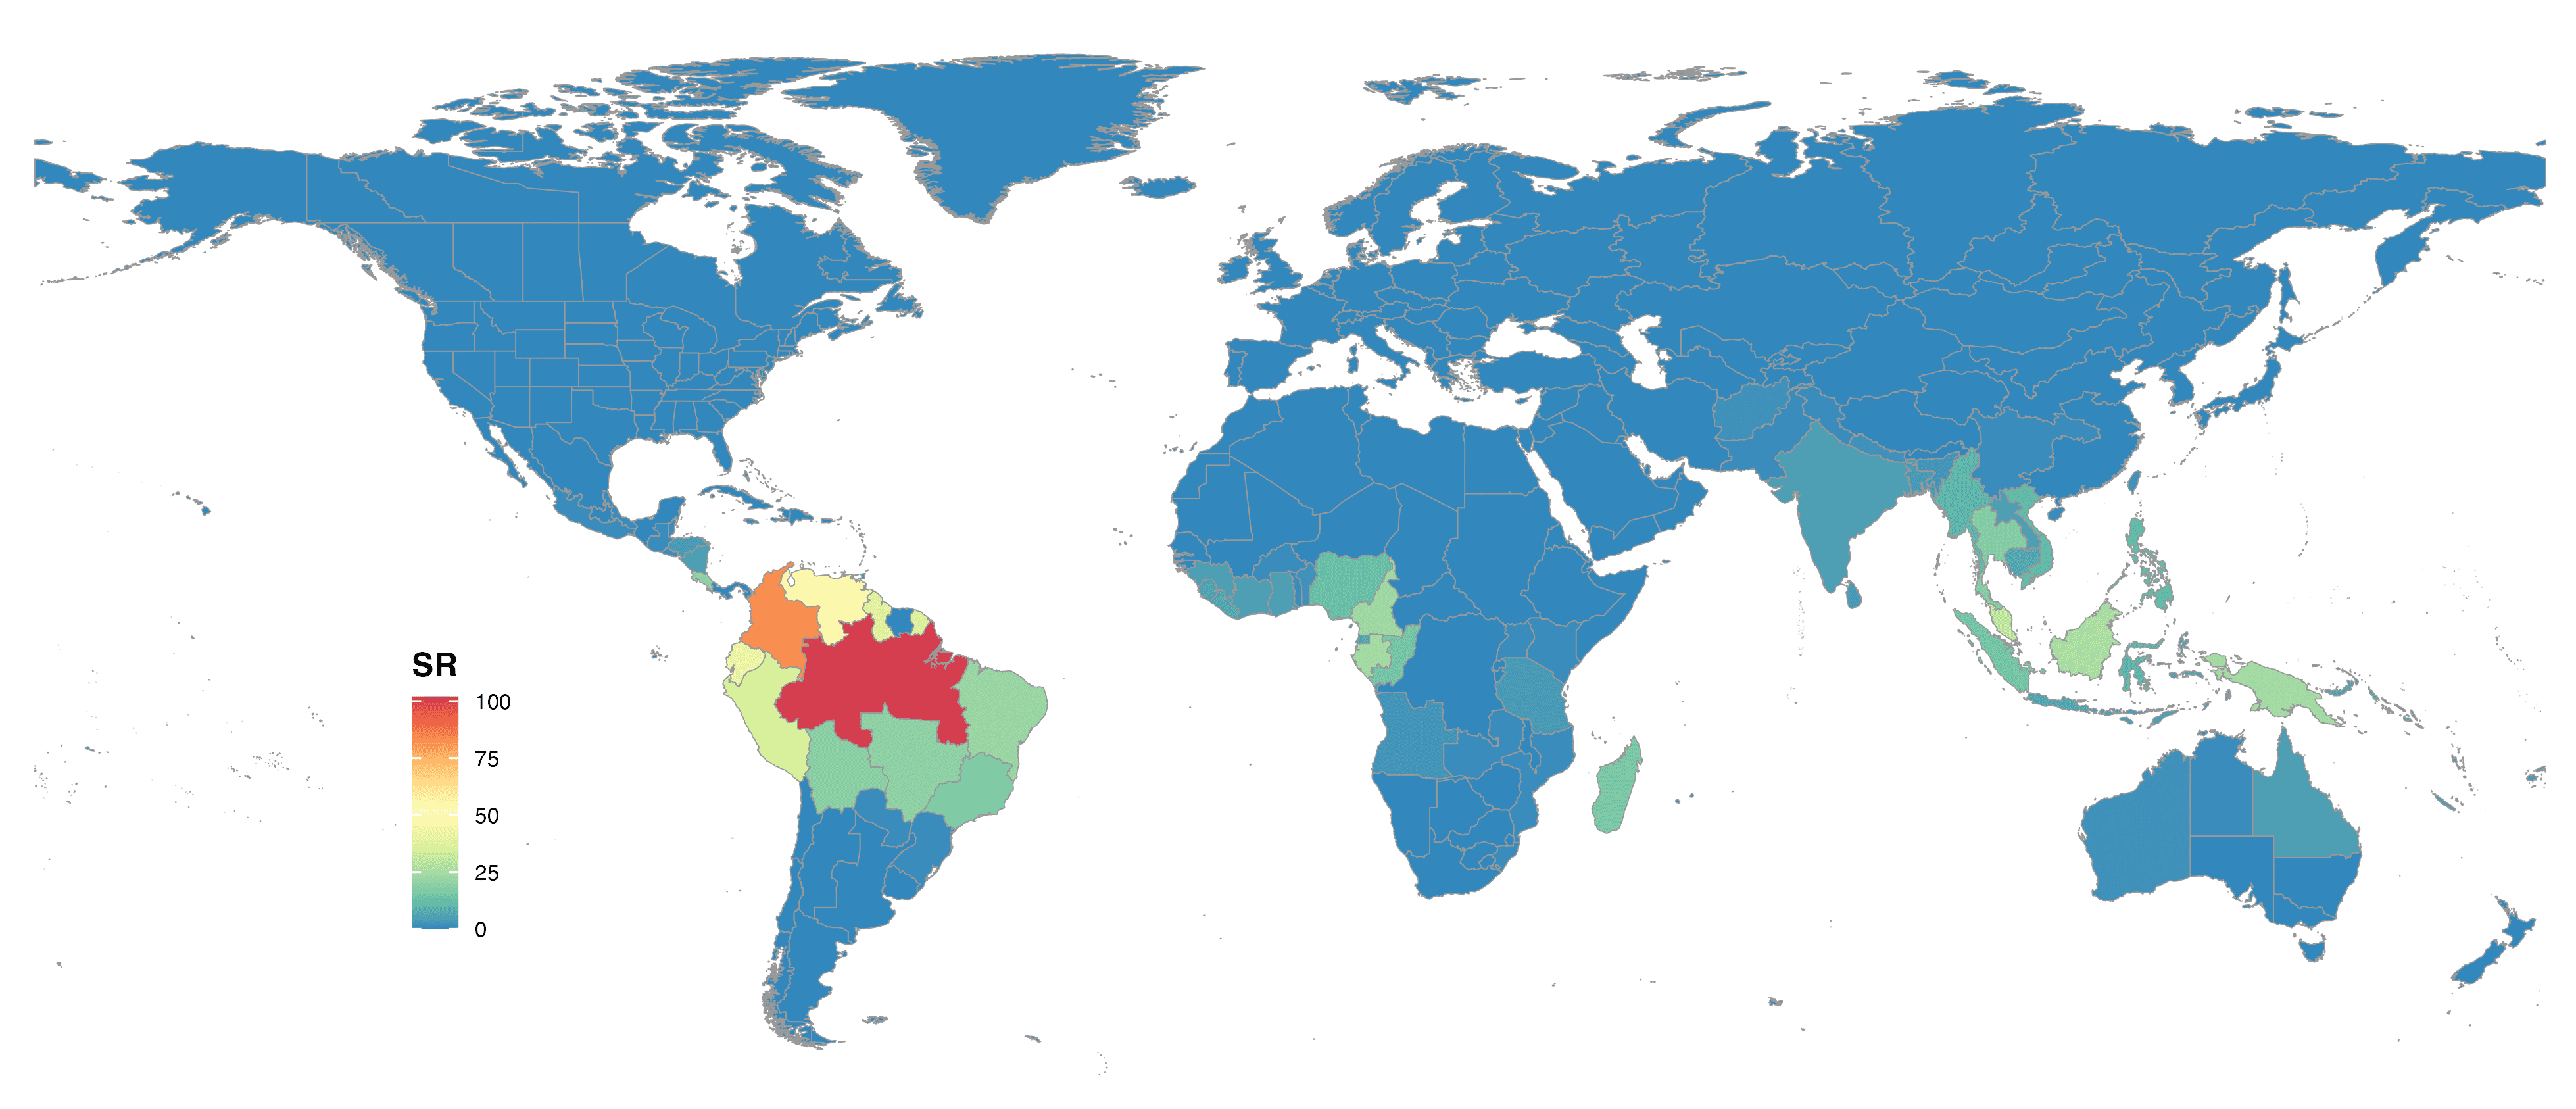
FIGURE 6. Global species richness of Lecythidaceae at botanical countries and colored with Spectral scale.
5. Using an external spreadsheet as input data in powoMap
It is possible to use data from other databases in order to create
global maps using our powoMap function. To perform this
task, the spreadsheet must have at least a column with species names and
one or two columns with associated distribution in the countries and/or
botanical countries. The species names must be binomial, and the country
names must be written in full and separated by a comma and a space right
after to the powoMap function works properly. The data
frame generated by our function powoSpecies can be used as
a model to create this standard spreadsheet (see the examples
above).
To use your external dataset as an imported spreadsheet, you must
provide the name of the object in the argument inputdf. The
powoMap function also will need information about the taxon
level to generate the maps. To do so, the user must provide the name of
the correspondent column in the argument taxclas (e.g.,
"family", "genus"). To indicate the column
with the distribution, change the distcol argument. If the
distribution is according to political country names (e.g., Brazil,
Peru), you just have to write the name of the column with this data.
Otherwise, if you need global maps according to the TDWG botanical
countries (level 3), you must indicate in which column this data (e.g.,
Brazil North, Peru) is stored and also change the argument
botctrs from FALSE to TRUE.